
Applying Basic Statistics To Analyze Attrition Data
"we dont know what we dont measure, what we dont measure, we dont control, what we dont control, we cannot sustain or improve"
Practical scenario
About 400 people have left the company during last six months! How many days did they stay, after being hired? How many people left early enough? How many people stayed at least three months with us? We should try to retain them for at least 180 days, worst case 90 days! Says, the senior management.
Statistical question
What is the mean tenure? What are 25th, 50th and 75th percentile values of the tenure? How is the tenure of 'people left' distributed?
Statistical analysis
Use Histogram to study the distribution of tenure, find the figure below.

Histogram - Distribution is skewed (most departures are around 8 to 38 days). Between 18 to 28 days 70 people left, 20 of them left between 8 to 18 days.
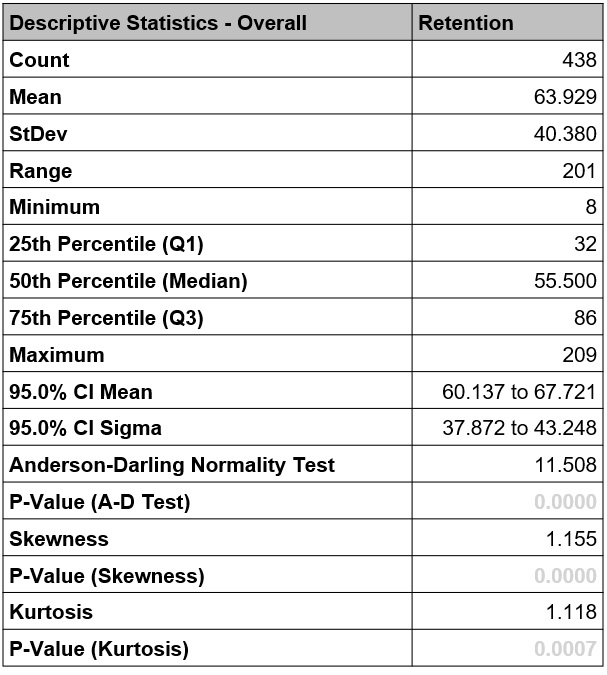
Basic statistics - Calculate the basic statistics and tabulate them a table as shown below. Average number of days people stayed before they left is 63 days. 25% (25th percentile) of them left within 32 days, 50% (50th percentile or median) left within 55 days, 75% (third quartile) of them left within 86 days. The worst case was someone leaving in 8 days while the best case was 209 days! One can say with 95% confidence, average tenure will lie between 60 to 67 days.
Practical inference
Situation is alarming! We hire new people and train them for a period of one month! If average tenure is 63 days, it means they are leaving just a month after their training! We need to know why are they leaving so early. We need to move the distribution to far right. Let Production and HR department meet to draw a plan - How to ensure new hires stay for a minimum 180 days?
Visit SKIL to know more about Lean Certification, Six Sigma Certification, Lean Six Sigma Black Belt, Project Management, Lean Six Sigma Green Belt etc.
